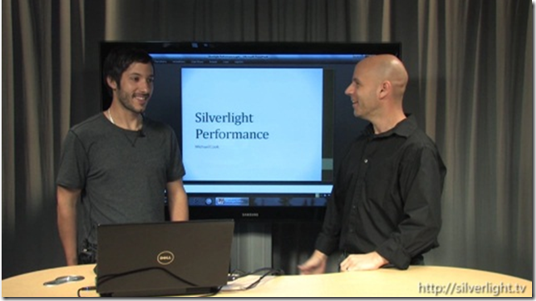
Application performance is a hot topic, and for good reason. User Experience is hugely important, but if your app is slow then everything degrades, including UX. In this episode, John talks to the Silverlight team's Mike Cook who shares several techniques that help tune Silverlight applications. With performance, it's all about knowing what tools to use and how to use them. Mike covers these topics and focuses on:
- CPU Profiling in Visual Studio 2010
- Memory Analysis
o VMMap - 30,000 ft view of app memory
o WinDbg + SOS Debug Extension - Managed memory analysis
o XPerf Heap Instrumentation - Native memory analysis
You can find all of the links for the tools and information on how to use them in the relevant links listed below.
Relevant links:
- John's blog and on Twitter (@john_papa)
- Silverlight Performance Blog
- Silverlight Performance Forum
- Visual Studio Profiler Blog
- VMMap
- WinDbg
- SOS
- Xperf (Windows Performance Toolkit)
Follow us on Twitter @SilverlightTV or on the web at http://silverlight.tv


