There are various ways you can debug server side code with VSCode. You may have a simple node server to crank up. Perhaps you use TypeScript and need to compile it to JavaScript before starting the server. You may also be using task automation with gulp or grunt and want to start the server and then attach VSCode’s debugger to it.
Visual Studio Code Series
Follow this series to learn more about what you can do with Visual Studio Code!
- Introducing Visual Studio Code
- Getting Started with Visual Studio Code
- Intellisense
- Refactoring
- Debugging
- Git Integration and Preferences
Debugging JavaScript
You can debug server side JavaScript in right in VSCode. Just create a debug launch task and go. First, click on the debug icon in the sidebar or CMD+SHIFT+D. Then click on the gear icon next to the debug button in the upper left. This opens the debug configuration settings (in .settings/launch.json).
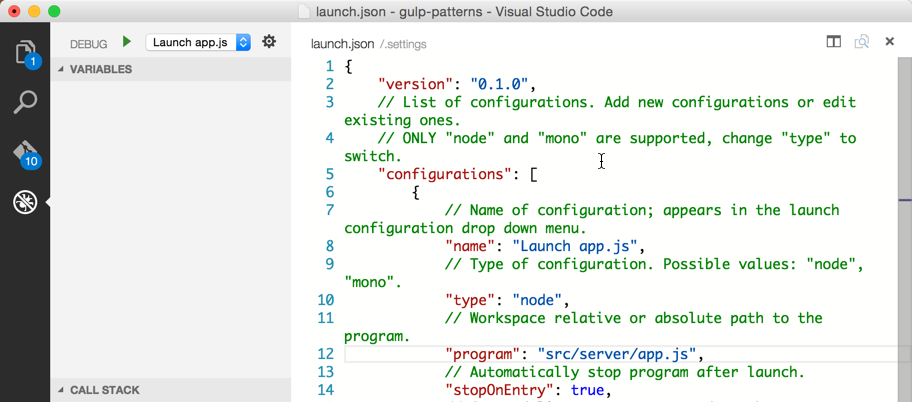
Here you can define a launch configuration for debugging. Notice the type is set to node and the program to start is set to /src/server/app.js (choose your path accordingly). It will also stop upon entry, so you can debug on the first entry point to the app.js. This is important when you want to see how the node server is being started.
Once the debug configuration is established you can choose your configuration form the dropdown and click the green button, or alternatively press F5 to begin debugging.
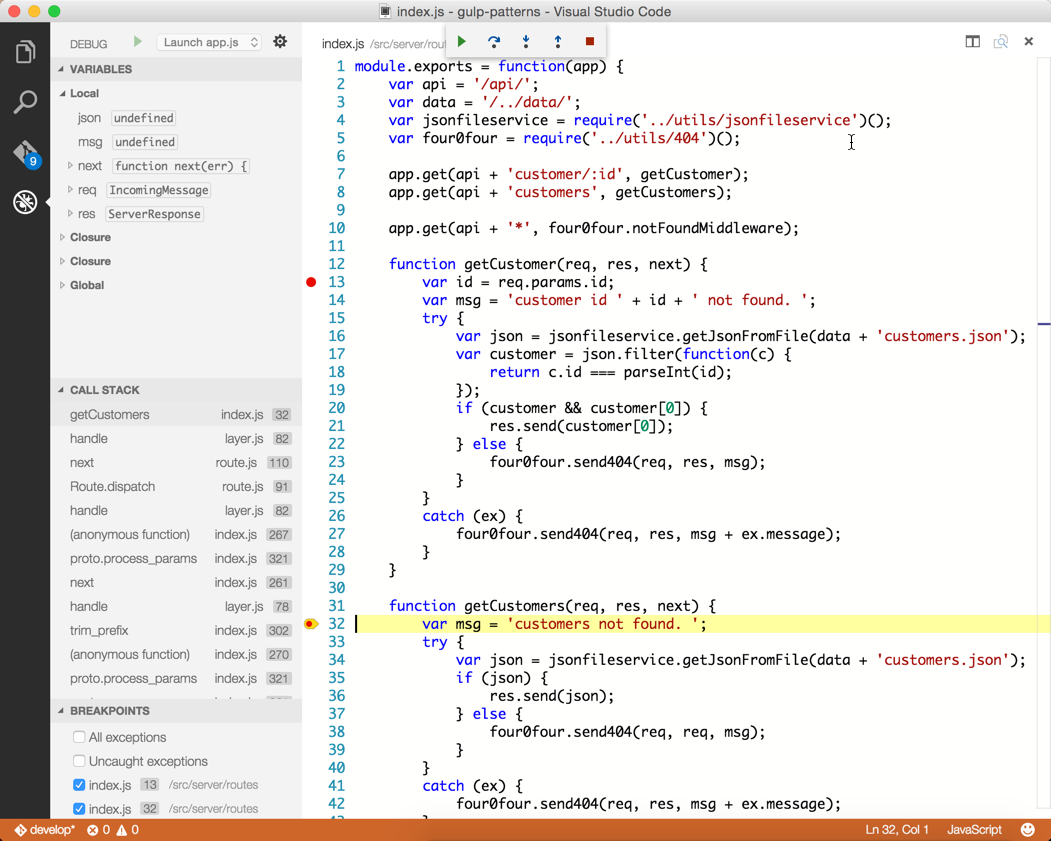
The node server will start and stop at the first line of code in app.js. You can then set watchers, breakpoints (or disable them), see the call stack, or examine local variables.
Debugging Menu Options
You can also step through the code using the debug menu in the top middle of VSCode.

The buttons have keyboard mappings for:
F5continueF10step overF11step intoSHIFT+F11step outSHIFT+F5stop
I often will set breakpoints in my routes and then go use the app in the browser. When the route is hit, the browser will wait and VSCode will show the breakpoint. This workflow is ideal for debugging calls between the browser and the server.
Debugging TypeScript
Debugging TypeScript is just as easy as JavaScript.
- Go to the debug configurations (
CMD+SHIFT+Pand typedebug config) - Set the
program to startto/src/server/app.ts(or whatever your path is) - Run the
Launch app.tsconfiguration - Set a breakpoint in
app.ts
Update: TypeScript debugging is now added in 0.3.0Update: Always clear your breakpoints, then attach, then add breakpoints. This is a bug and has been reported.
Enjoy debugging!


